Primarily for teaching purposes, I have become interested in different ways of visualising data pertaining to Chinese history. Here I list some of the visualisations of data I have done using Tableau and Flourish. I have included both a video/picture version and a direct link to the visualisation on Tableau or Flourish.
Volume of Foreign Trade at Major Chinese Ports, 1867-1936
(Visualisation of Chinese Maritime Customs Service Data provided in Hsiao, China’s Foreign Trade Statistics, 1864-1949.)
Number of Foreign Vessels in the Foreign and Interport Trade of China, 1864-1940
(Visualisation of Chinese Maritime Customs Service Data provided in Hsiao, China’s Foreign Trade Statistics, 1864-1949.)
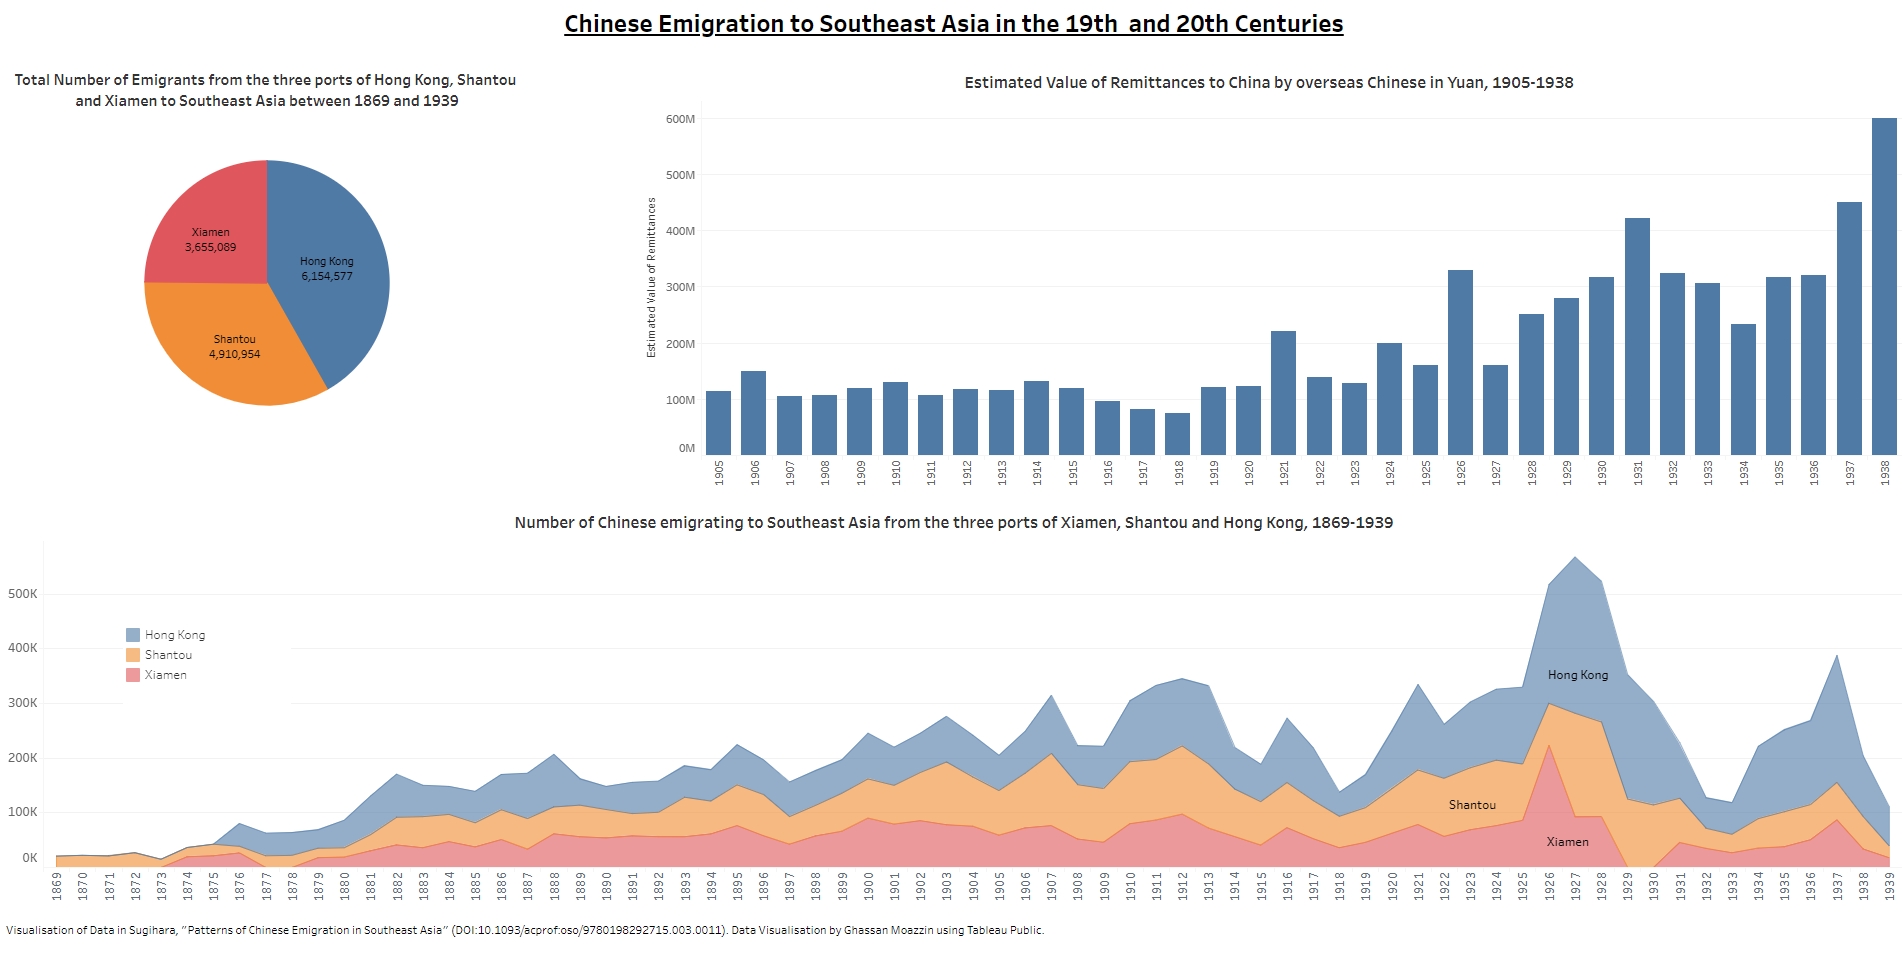
Chinese Emigration to Southeast Asia in the 19th and 20th Centuries
(Visualisation of Data in Sugihara, “Patterns of Chinese Emigration to Southeast Asia, 1869–1939”)
Foreign Population in China, 1882-1930
(Visualisation of Data in from Takeshi Hamashita, Chugoku kindai keizai shi kenkyu, 34-35; Chinese Maritime Customs Service, Decennial Reports (1882-1891, 1892-1901, 1912-1921) and Foreign Trade of China (1922, 1923, 1925, 1930)).
Population Growth in China’s Ports, 1891-1921
(Visualisation of Data in Chinese Maritime Customs Service, Decennial Reports (1882-1891, 1892-1901, 1902-1911, 1912-1921)).
Number of Foreign Businesses in China’s Treaty Ports, 1882-1921
(Visualisation of Data in Chinese Maritime Customs Service, Decennial Reports (1882-1891, 1892-1901, 1902-1911, 1912-1921)).
https://public.tableau.com/views/NumberForeignBusinessesChina1882-1921/Dashboard1?
China’s Foreign Trade Volume (Exports + Imports) by Major Countries, 1864-1937
(Visualisation of Data in Hsiao, China’s Foreign Trade Statistics).
